自 2025 年 3 月 27 日起,我们建议您使用 android-latest-release
而非 aosp-main
构建 AOSP 并为其做出贡献。如需了解详情,请参阅 AOSP 的变更。
VTS 信息中心界面
使用集合让一切井井有条
根据您的偏好保存内容并对其进行分类。
VTS 信息中心提供了一个利用 Material Design 有效显示与测试结果、剖析和覆盖率相关的信息的统一界面。
信息中心样式使用 Materialize CSS 和 jQueryUI 等开放源代码 JavaScript 库来处理由 Google App Engine 中的 Java Servlet 传送的数据。
信息中心首页
信息中心首页会显示相应用户已向收藏夹中添加的一系列测试套件。
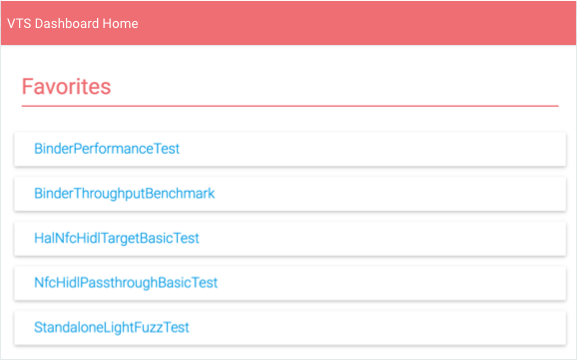
图 1. VTS 信息中心 - 首页。
用户可在此列表中执行以下操作:
- 选择某个测试套件以查看该套件的结果。
- 点击全部显示以查看所有 VTS 测试名称。
- 选择编辑图标以修改“收藏夹”列表。
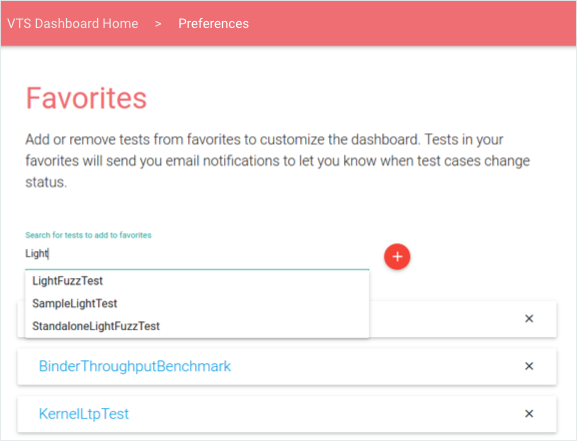
图 2. VTS 信息中心 - 编辑“收藏夹”页面。
测试结果
测试结果会显示有关所选测试套件的最新信息,其中包括性能分析点列表、测试用例结果(按时间顺序排列)表格,以及用来显示最新运行结果细分的饼图(用户可通过向右翻页来加载先前的数据)。
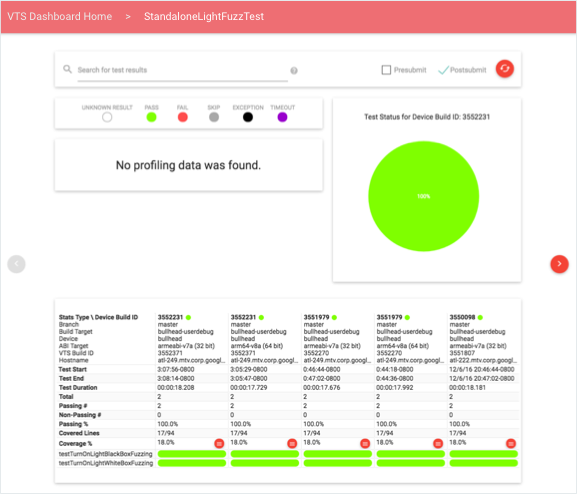
图 3. VTS 信息中心 - 测试结果。
用户可通过使用查询或修改测试类型(提交前和/或提交后)来过滤数据。搜索查询支持通用令牌和特定于字段的限定符;受支持的搜索字段包括:设备 build 号、分支、目标名称、设备名称和测试 build 号。这些字段均需使用以下格式进行指定:FIELD-ID="SEARCH QUERY"。引号用于将多个字词作为单个令牌以与列中的相应数据匹配。
数据剖析
用户可通过选择一个性能分析点,在线形图或直方图(示例如下)中查看该点对应的量化数据的交互式视图。默认情况下,该视图会显示最新信息;用户可以使用日期选择器加载特定时间范围内的信息。
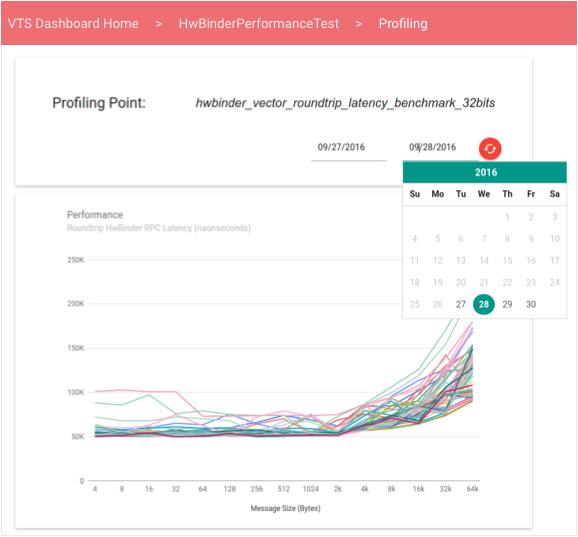
图 4. VTS 信息中心 - 性能线形图。
线形图会显示某个无序性能值集合中的数据;当某项性能测试生成一个与性能值(会随另一个变量(如吞吐量或信息大小)而变化并与之形成函数关系)对应的矢量时,该图会非常有用。
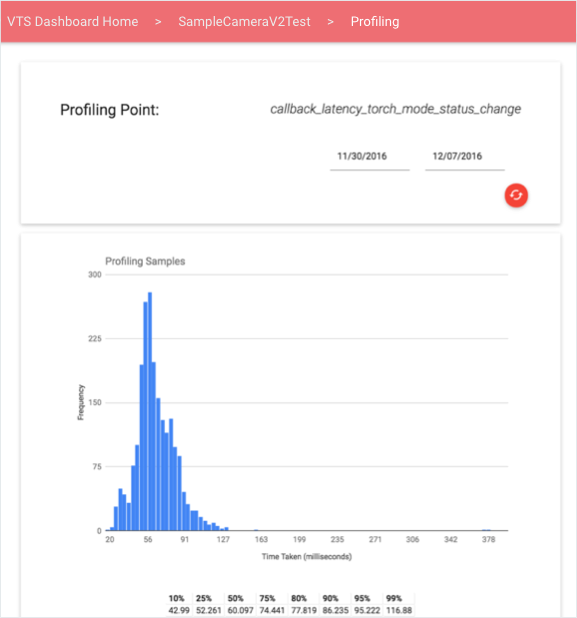
图 5. VTS 信息中心 - 性能直方图。
测试覆盖率
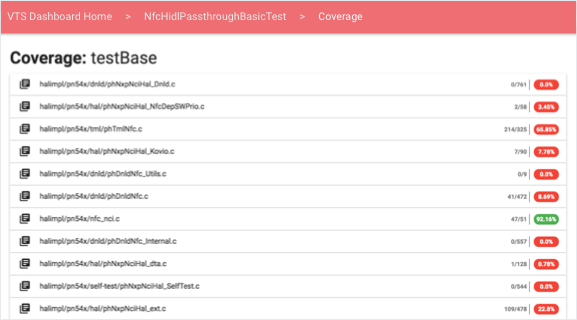
用户可通过测试结果中的覆盖率百分比链接查看覆盖率信息。
图 6. VTS 信息中心 - 覆盖率百分比。
对于每个测试用例和源文件,用户都可根据所选测试提供的覆盖率,查看包含用不同颜色标识的源代码的可扩展元素:
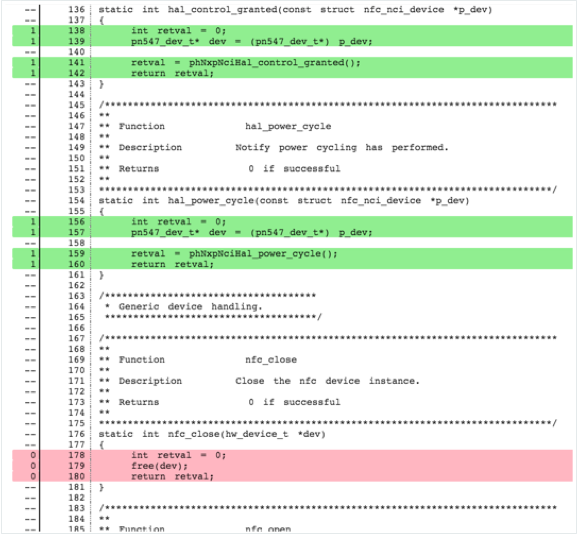
图 7. VTS 信息中心 - 覆盖率源代码。
- 未覆盖的行用红色突出显示。
- 已覆盖的行用绿色突出显示。
- 不可执行的行未着色。
覆盖率信息可分为不同的部分,具体取决于其在运行时的提供方式。测试可通过以下方式上传覆盖率信息:
- 按函数。各部分的标题均采用“Coverage: FUNCTION-NAME”格式。
- 总计(在测试运行结束时提供)。只显示 1 个标题:“Coverage: All”。
信息中心会从使用开放源代码 Gerrit REST API 的服务器处获取源代码客户端。
监控和测试
VTS 信息中心提供以下监控和单元测试。
- 测试电子邮件警报。警报均是在以两 (2) 分钟的固定时间间隔执行的 Cron 作业中进行配置。该作业会读取 VTS 状态表,以确定新数据是否已上传到每个表格中 - 方法是:检查测试的原始数据上传时间戳是否比上次状态更新时间戳新。如果上传时间戳较新,该作业便会查询当前原始数据上传中包含的新数据(与上次原始数据上传相较而言)。系统会确定新的测试用例失败、持续的测试用例失败、瞬态测试用例失败、测试用例修复和无效的测试,然后将这些信息以电子邮件的格式发送给各项测试的订阅者。
- 网络服务运行状况。Google Stackdriver 集成了 Google App 引擎,可轻松监控 VTS 信息中心。您既可使用简单的运行时间检查来验证网页能否被访问,也可创建其他测试来检查每个网页、servlet 或数据库中的延迟情况。这些检查可确保信息中心始终处于可访问的状态(否则将通知管理员)。
- Google Cloud Analytics。通过在页面配置(pom.xml 文件)中指定有效的 Google Cloud Analytics ID,您可以将 VTS 信息中心页面与 Google Cloud Analytics 集成。集成后,您便能够更全面地分析网页使用情况、用户互动、位置、会话统计信息等。
本页面上的内容和代码示例受内容许可部分所述许可的限制。Java 和 OpenJDK 是 Oracle 和/或其关联公司的注册商标。
最后更新时间 (UTC):2025-07-27。
[null,null,["最后更新时间 (UTC):2025-07-27。"],[],[],null,["# VTS Dashboard UI\n\nThe VTS Dashboard provides a cohesive user interface that uses material design\nto effectively display information about test results, profiling, and coverage.\nDashboard styling uses open-source Javascript libraries including Materialize\nCSS and jQueryUI to process data delivered by Java servlets in Google App\nEngine.\n\nDashboard home\n--------------\n\n\nThe Dashboard home page displays a list of test suites a user has added to\nfavorites.\n**Figure 1.** VTS Dashboard, home page.\n\n\nFrom this list, users can:\n\n- Select a test suite to view results for that suite.\n- Click **SHOW ALL** to view all VTS test names.\n- Select the **Edit** icon to modify the Favorites list. \n **Figure 2.** VTS Dashboard, editing Favorites page.\n\nTest results\n------------\n\n\nTest Results displays the latest information about the selected test suite,\nincluding a list of profiling points, a table of test case results in\nchronological order, and a pie chart displaying the result breakdown of the\nlatest run (users can load older data by paging right).\n**Figure 3.** VTS Dashboard, test results.\n\n\nUsers can filter data using queries or by modifying the test type (pre-submit,\npost-submit, or both). Search queries support general tokens and field-specific\nqualifiers; supported search fields are: device build ID, branch, target name,\ndevice name, and test build ID. These are specified in the format:\n\u003cvar translate=\"no\"\u003eFIELD-ID\u003c/var\u003e=\"\u003cvar translate=\"no\"\u003eSEARCH QUERY\u003c/var\u003e\". Quotes are used to treat multiple\nwords as a single token to match with the data in the columns.\n\nData profiling\n--------------\n\n\nUsers can select a profiling point to reach an interactive view of the\nquantitative data for that point in a **line graph** or\n**histogram** (examples below). By default, the view displays the\nlatest information; users can use the date picker to load specific time windows.\n**Figure 4.** VTS Dashboard, line graph performance.\n\n\nLine graphs display data from a collection of unordered performance values,\nwhich can be useful when a test of performance produces a vector of performance\nvalues that vary as a function of another variable (e.g., throughput versus\nmessage size).\n**Figure 5.** VTS Dashboard, histogram performance.\n\nTest coverage\n-------------\n\n\nUsers can view coverage information from the coverage percent link in test\nresults.\n**Figure 6.** VTS Dashboard, coverage percentages.\n\n\nFor each test case and source file, users can view an expandable element\ncontaining color-coded source code according to the coverage provided by the\nselected test:\n**Figure 7.** VTS Dashboard, coverage source code.\n\n- Uncovered lines are highlighted red.\n- Covered lines are highlighted green.\n- Non-executable lines are **uncolored**.\n\n\nCoverage information is grouped depending into sections depending on how it was\nprovided at run-time. Tests may upload coverage:\n\n- **Per function** . Section headers have the format \"Coverage: \u003cvar translate=\"no\"\u003eFUNCTION-NAME\u003c/var\u003e\".\n- **In Total** (provided at the end of the test run). Only one header is present: \"Coverage: All\".\n\n\nThe Dashboard fetches source code client-side from a server, which uses the\nopen-source\n[Gerrit REST API](https://gerrit-review.googlesource.com/Documentation/rest-api.html).\n\nMonitoring and testing\n----------------------\n\n\nThe VTS Dashboard provides the following monitors and unit tests.\n\n- **Test email alerts**. Alerts are configured in a Cron job that executes at a fixed interval of two (2) minutes. The job reads the VTS status table to determine if new data has been uploaded to each table, done by checking the test's raw data upload timestamp is newer than the last status update timestamp. If the upload timestamp is newer, the job queries for new data between now and the last raw data upload. New test case failures, continued test case failures, transient test case failures, test case fixes, an inactive tests are determined; this information is then sent in email format to the subscribers of each test.\n- **Web service health**. Google Stackdriver integrates with Google App Engine to provide easy monitoring of the VTS Dashboard. Simple uptime checks verify pages can be accessed while other tests can be created to verify latency on each page, servlet, or database. These checks ensure the Dashboard is always accessible (else an administrator will be notified).\n- **Analytics**. You can integrate a VTS Dashboard page with Google Cloud Analytics by specifying a valid Analytics ID in the page configuration (the pom.xml file). Integration provides a more robust analysis of page usage, user interaction, locality, session statistics, etc."]]